PERFORMANCE PAGES — IF EQUIPPED
Performance Pages is an application that provides a display for performance indicators that will help you gain familiarity with the capabilities of your SRT vehicle in real time.
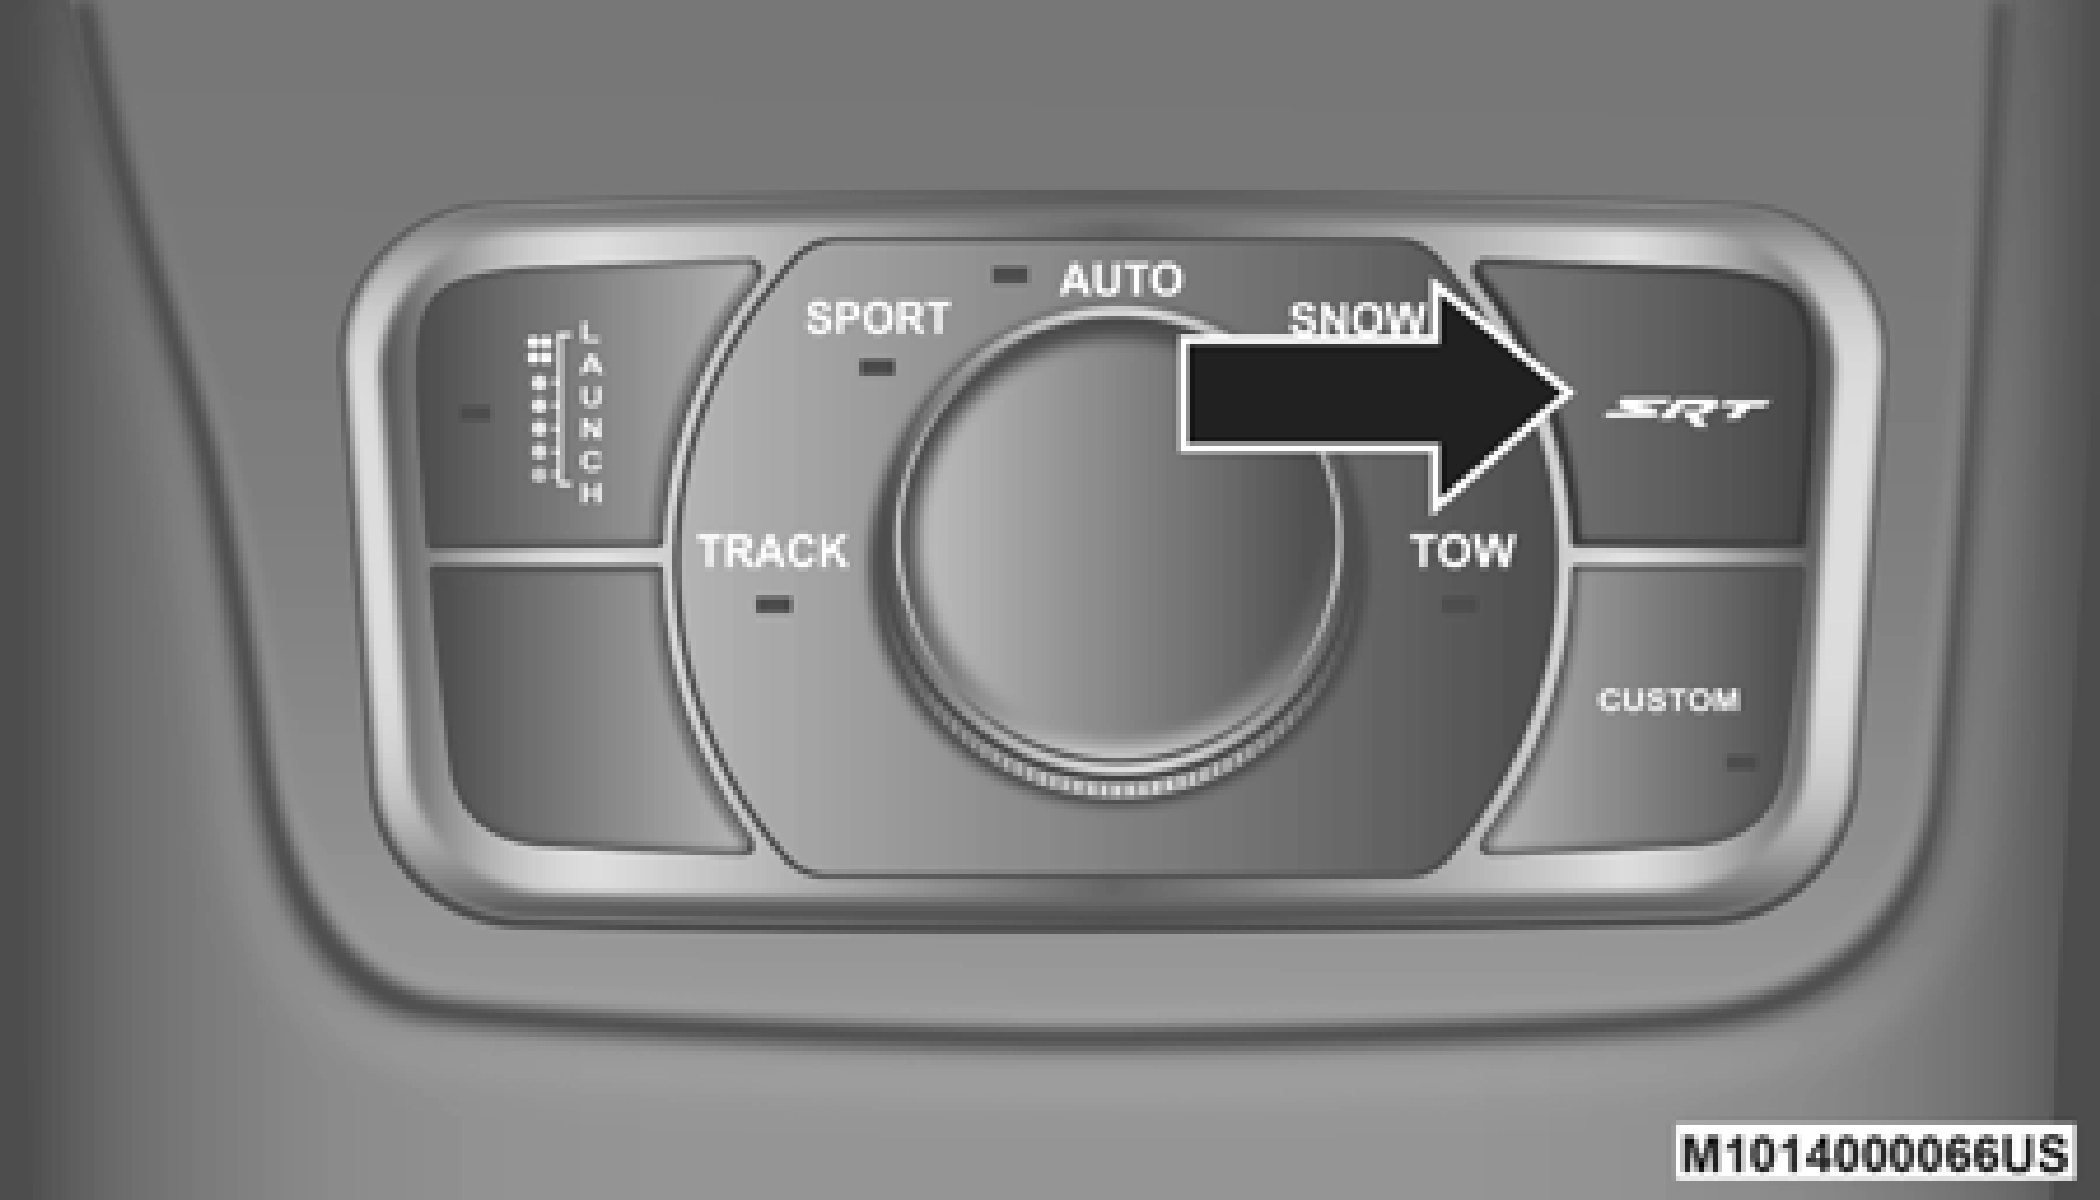
To access the SRT Performance Pages, press the SRT button on the center stack near the gear shifter. Then press the Performance Pages tab on the Dashboard page. Or, from the apps menu, select the Performance Pages app.
SRT Button
The Performance Pages include the following:
The following describes each feature and its operation:
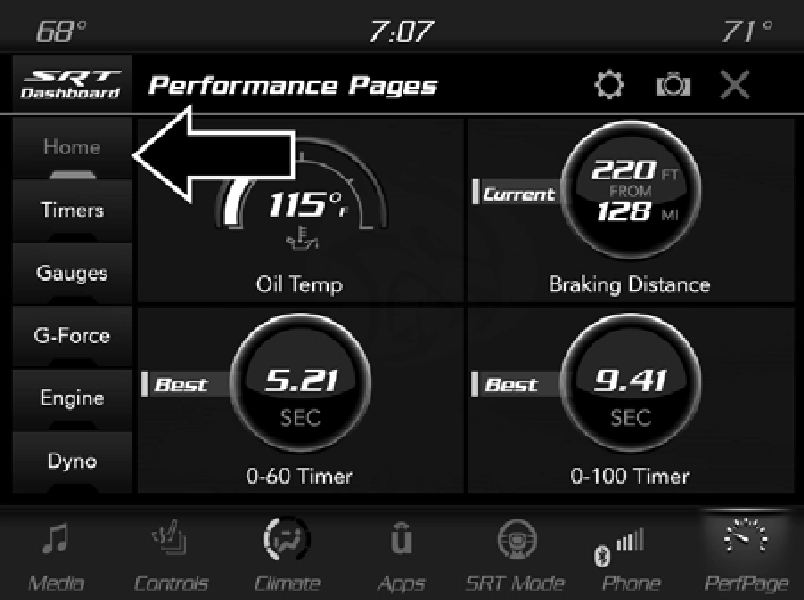
Performance Pages — Home
When Home is selected, a series of widgets (gauges) can be customized by the user. Follow these steps to change a widget. Either press directly on the widget you want to change, or:
Historical Data
The “Historical Data” feature allows you to view informa- tion about your vehicle such as the vehicle’s VIN number, miles on the odometer, longitude and latitude coordinates, and more.
To activate the Historical Data feature on your touchscreen, follow these steps:
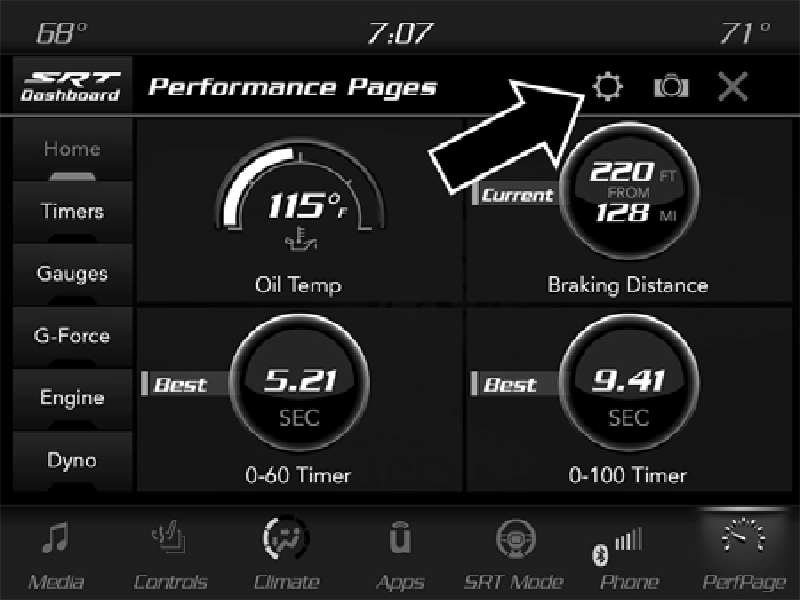
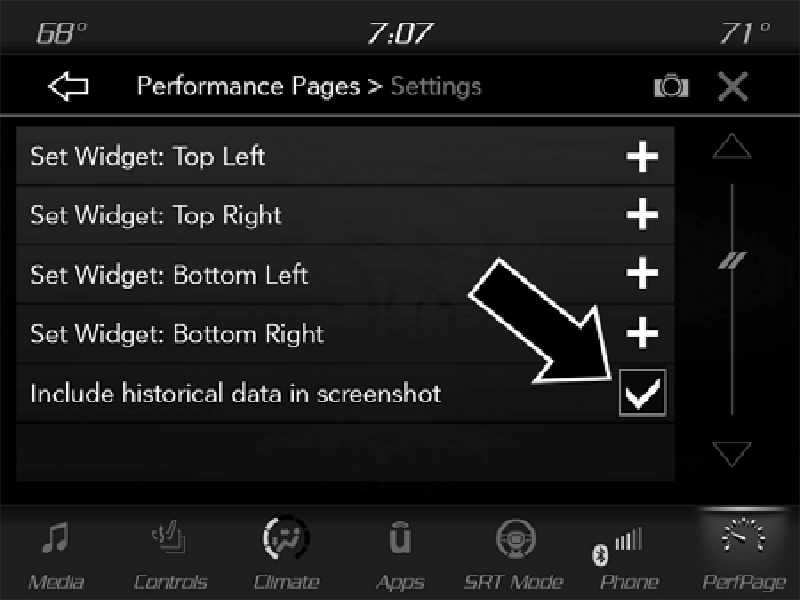
Home Page Settings
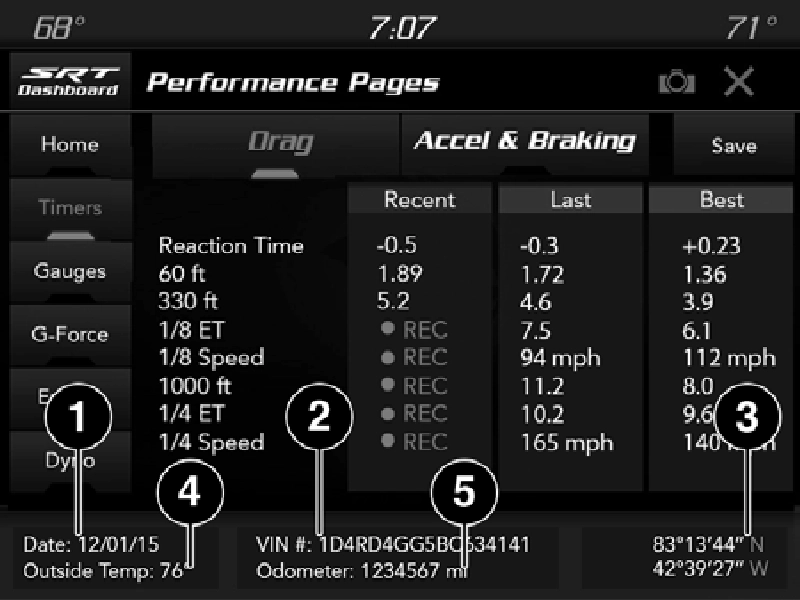
1 — Date
Historical Data Information
NOTE:
Historical Data Screenshot
Once the checkbox is selected, the bottom bar of the screen will be replaced with the historical data from your vehicle present at the time the screenshot icon was pressed.
Historical Data Camera Icon
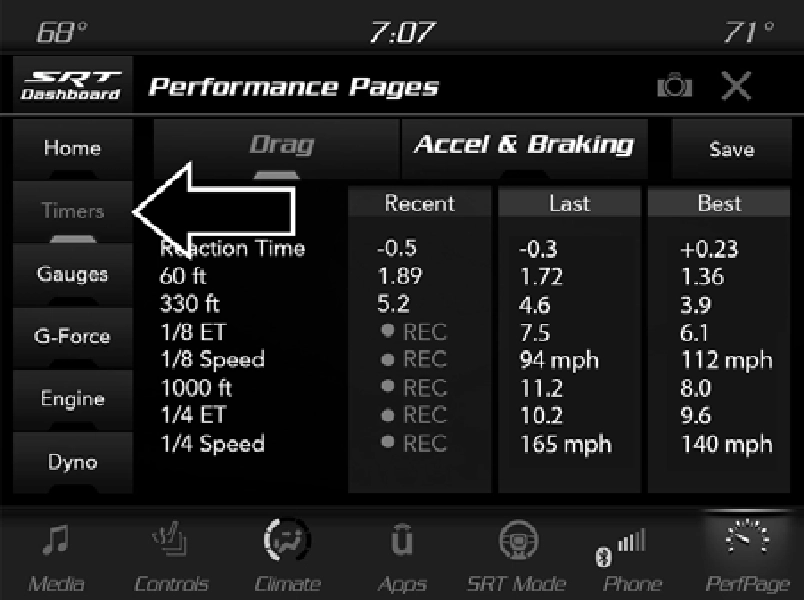
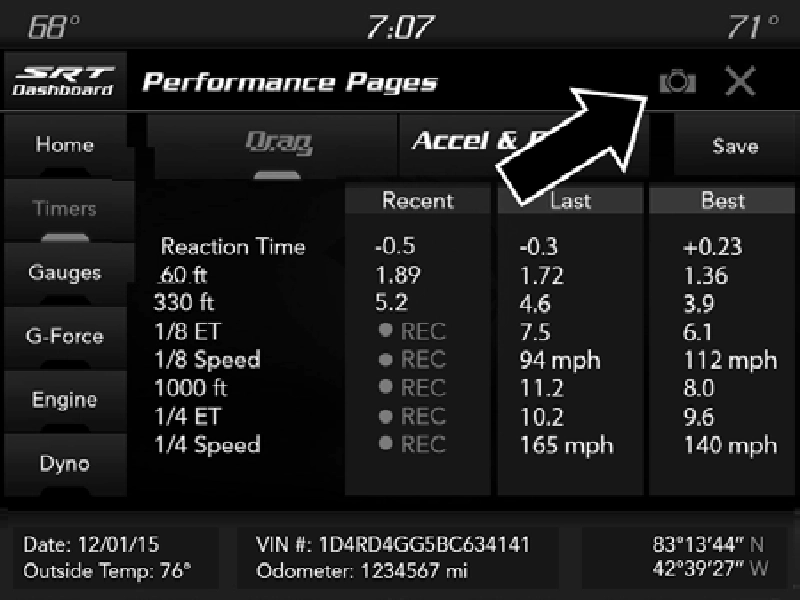
Performance Pages — Timers
When the Timers Page is selected, you will be able to select the Drag or Accel & Braking tabs. The following will be displayed:
A real-time summary of performance timers.
The last recorded run of performance timers.
The best recorded run of performance timers, except for braking data.
Pressing the Save button will let you save the Recent, Last, Best run. Any saved run over 10 will overwrite the oldest saved run for Uconnect System storage. The operation of the Save feature is listed below:
NOTE:
Pressing the Camera icon in the upper right corner of the touchscreen at any time will save a screenshot of the screen currently being viewed to the connected USB device.
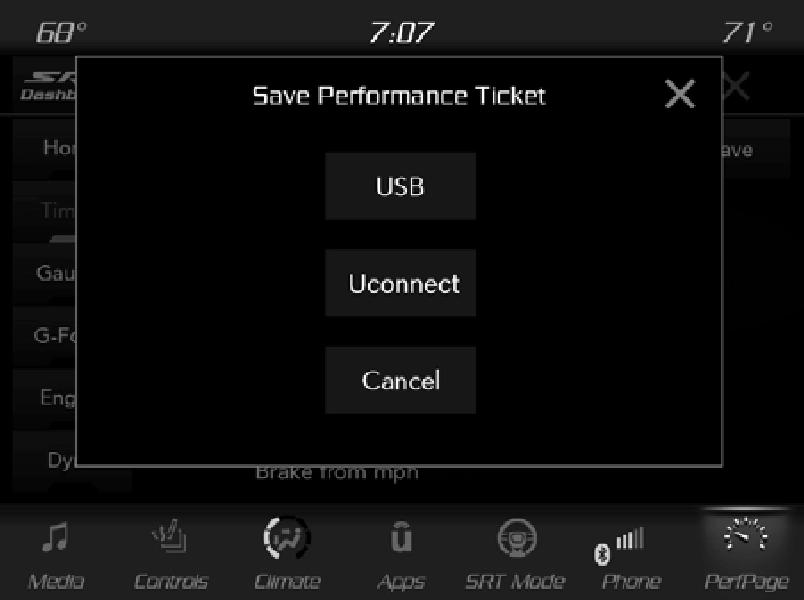
Performance Pages — Save
web page.
NOTE:
Uconnect option will be grayed out or missing if the vehicle does not have a valid Uconnect account associated with it.
The tabs on the Timers page contain the timers listed below
Measures the driver's reaction time for launching the vehicle against a simulated drag strip timing light (behavior modeled after 500 Sportsman Tree) displayed in the instrument cluster display.
NOTE:
Drag timers (RT, 60 ft (20 m), 330 ft (100 m), 1/8 mile
(200 m), 1000 ft (300 m), and 1/4 mile (400 m)) and Accelera-
tion Timers (0-60 mph (0-96 km/h) and 0-100 mph (0-160 km/h)) will be “ready” to acquire new Recent data measurements when the vehicle is at 0 mph (0 km/h).
Displays the time it takes for the vehicle to go from 0 to 60 mph (0 to 100 km/h).
Displays the time it takes for the vehicle to go from 0 to 100 mph (0 to 160 km/h).
Displays the time it takes the vehicle to go 60 ft (20 m).
Displays the time it takes the vehicle to go 330 ft (100 m).
Displays the time it takes for the vehicle to go 1/8 mile (200 m).
Displays the vehicle speed at the time 1/8 mile (200 m) was reached.
Displays the time it takes the vehicle to go 1000 ft (300 m).
Displays the time it takes for the vehicle to go 1/4 mile (400 meters).
Displays the speed the vehicle was at when 1/4 mile (400 meters) was reached.
Displays the distance it takes the vehicle to make a complete stop.
NOTE:
The distance measurement will be aborted if the brake pedal is released or the parking brake is engaged, before the vehicle comes to a complete stop.
Displays the speed of the vehicle it is traveling when the brake pedal is pressed.
NOTE:
Brake Distance and Speed timers only displays "ready" when vehicle is traveling at greater than 30 mph (48 km/h).
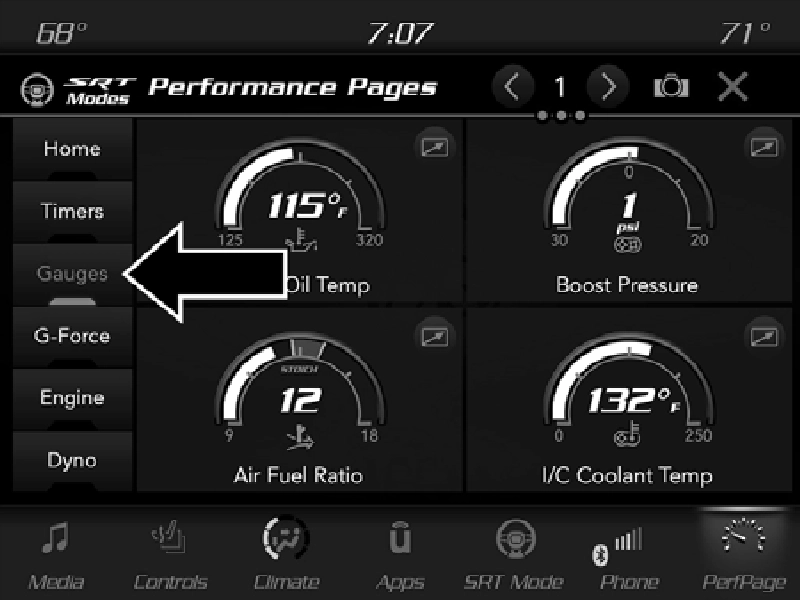
Performance Pages — Gauges
When selected, this screen displays the following values: 9
Shows the actual oil temperature.
Shows the actual oil pressure.
Shows the actual coolant temperature.
Shows actual battery voltage.
Shows actual transmission oil temperature.
Shows actual boost pressure.
Shows current air fuel ratio.
Shows actual I/C Coolant temperature.
Shows actual air intake temperature.
If a gauge is selected, the Gauge Detail View page will appear on the screen. This page shows further information on the selected gauge.
Pressing the left and right arrows will cycle through the details for each of the gauges. Pressing the minimize button above the graph will return to the gauge menu.
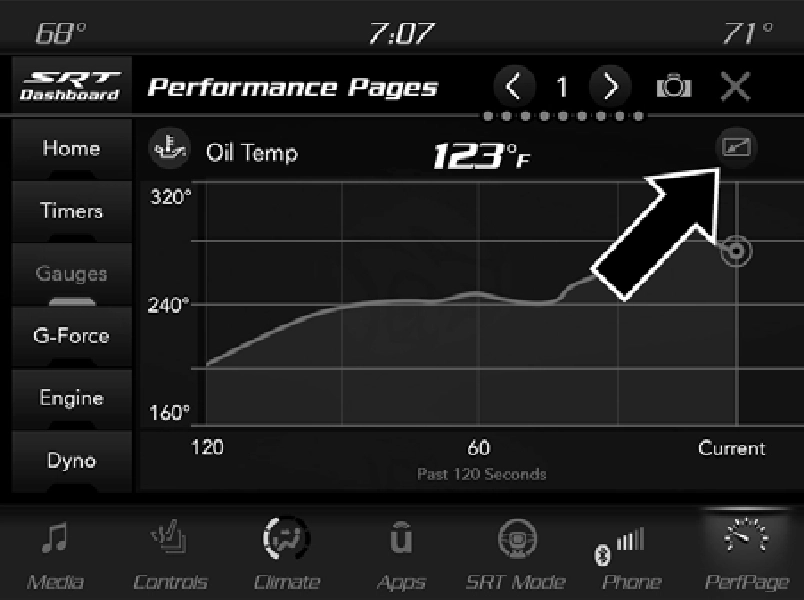
Gauge Detail View Page
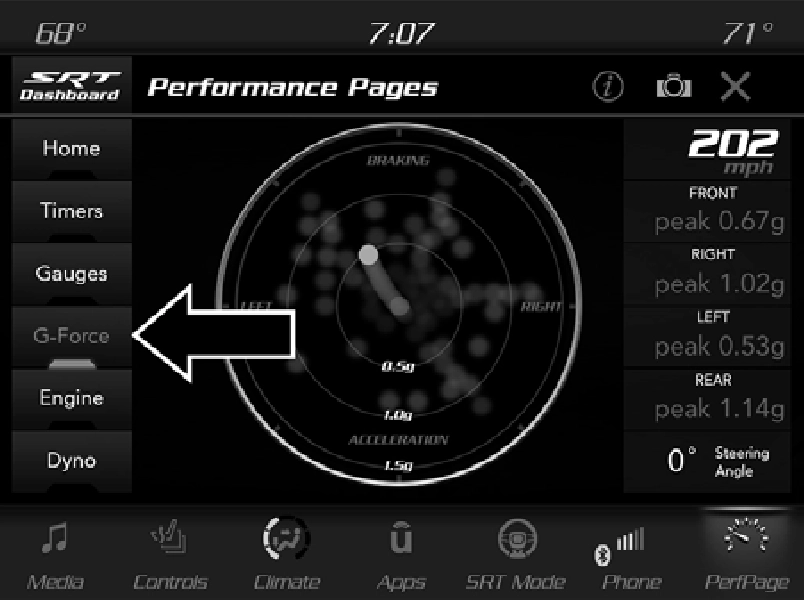
G-Force
When G-Force is selected, the following features will be available:
Measures the current speed of the vehicle in either mph or km/h, starting at zero with no maximum value.
Measures the peak braking force on the front of the vehicle.
Measures the peak force on the right side of the vehicle.
Measures the peak force on the left of the vehicle.
Measures the peak acceleration force on the rear of the vehicle.
When selected, this screen displays all four G-Force values as well as steering angle.
NOTE: 9
Front, Right, Left, and Rear G-Forces are all peak values. These readings can be reset by clearing peak G-Force on the instrument cluster.
Steering Wheel Angle utilizes the steering angle sensor to measure the degree of the steering wheel relative to zero. The zero degree measurement indicates a steering wheel straight ahead position.
The friction circle display shows instantaneous G-Force as a highlight and previous G-Force as dots within the circle. The system records previous G-Force for three minutes. If there are multiple samples at a given point, the color of the dot will darken from blue to red. Vectors more frequent will show in red; infrequent vectors will show in blue.
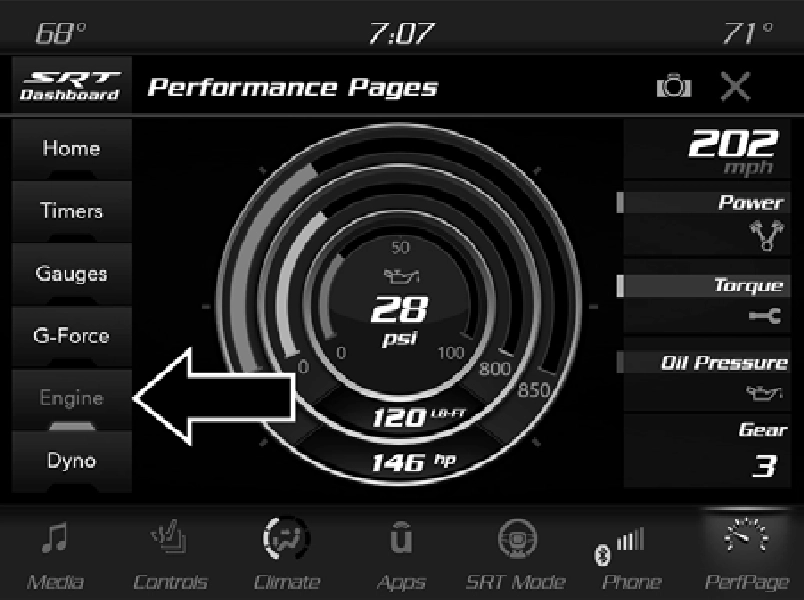
6.4L Engine
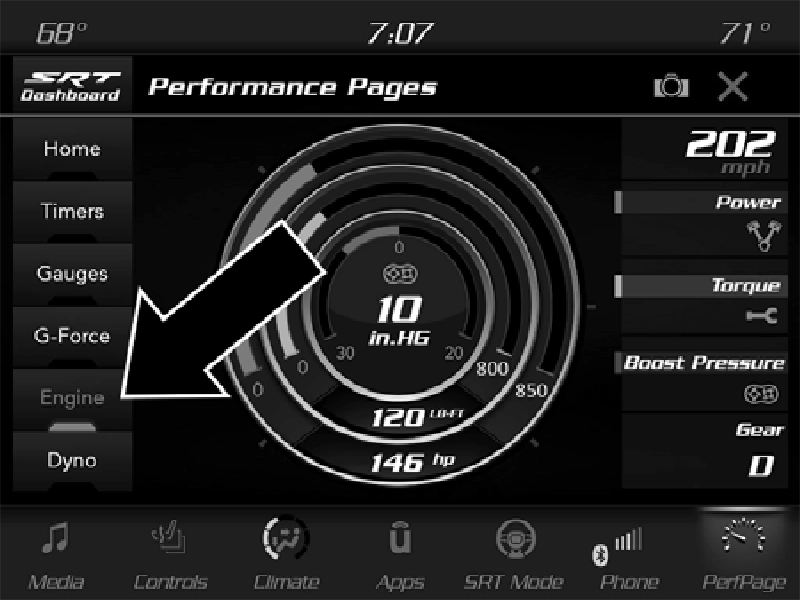
6.2L Engine
When selected, this screen displays the following values:
Shows the actual vehicle speed.
Shows the instantaneous power.
Shows the instantaneous torque.
Shows the actual engine oil pressure.
Shows the current (or pending) operating gear of the vehicle.
Shows the actual boost pressure.
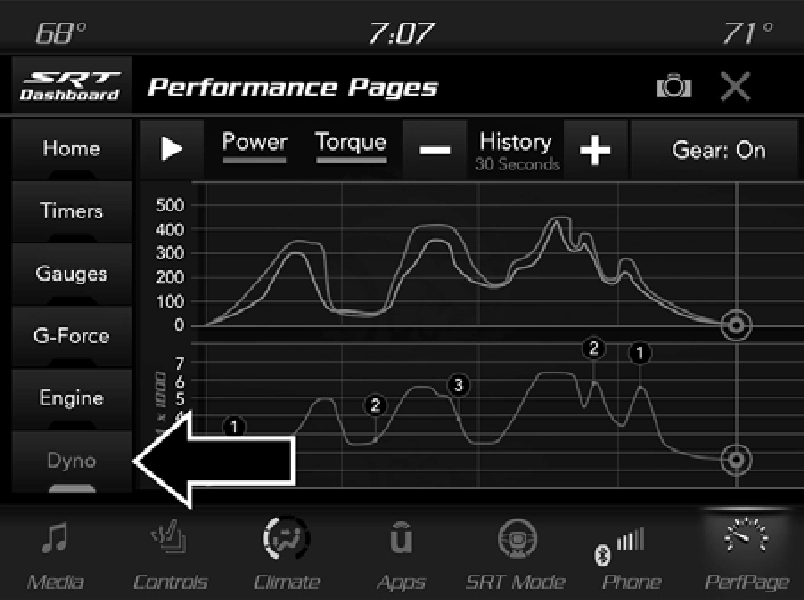
Dyno Page
The system will start drawing graphs for Power and Torque (top chart) and engine speed (bottom chart). The graph will fill to the right side of the page (based on History time selected). Once the right side of the page is reached, the graph will scroll with the right side always being the most recent recorded sample. Data toward the left edge is older.
The following options can be selected:
NOTE:
The Gear on/off feature will only display if your vehicle is equipped with an Automatic Transmission.
Download Manual